Loading...

Open NYC

Home / Open NYC

Visualizations for New York City

Here holds my enthusiasms for visualizing New York's open data. I hope to achieve a high performance data visualization for big data, leveraging the following technologies together: WebGL, DataShader, D3. PIXI. MapboxGL, Crossfilter and WebWorker.

NYC Open Data

Census 2010

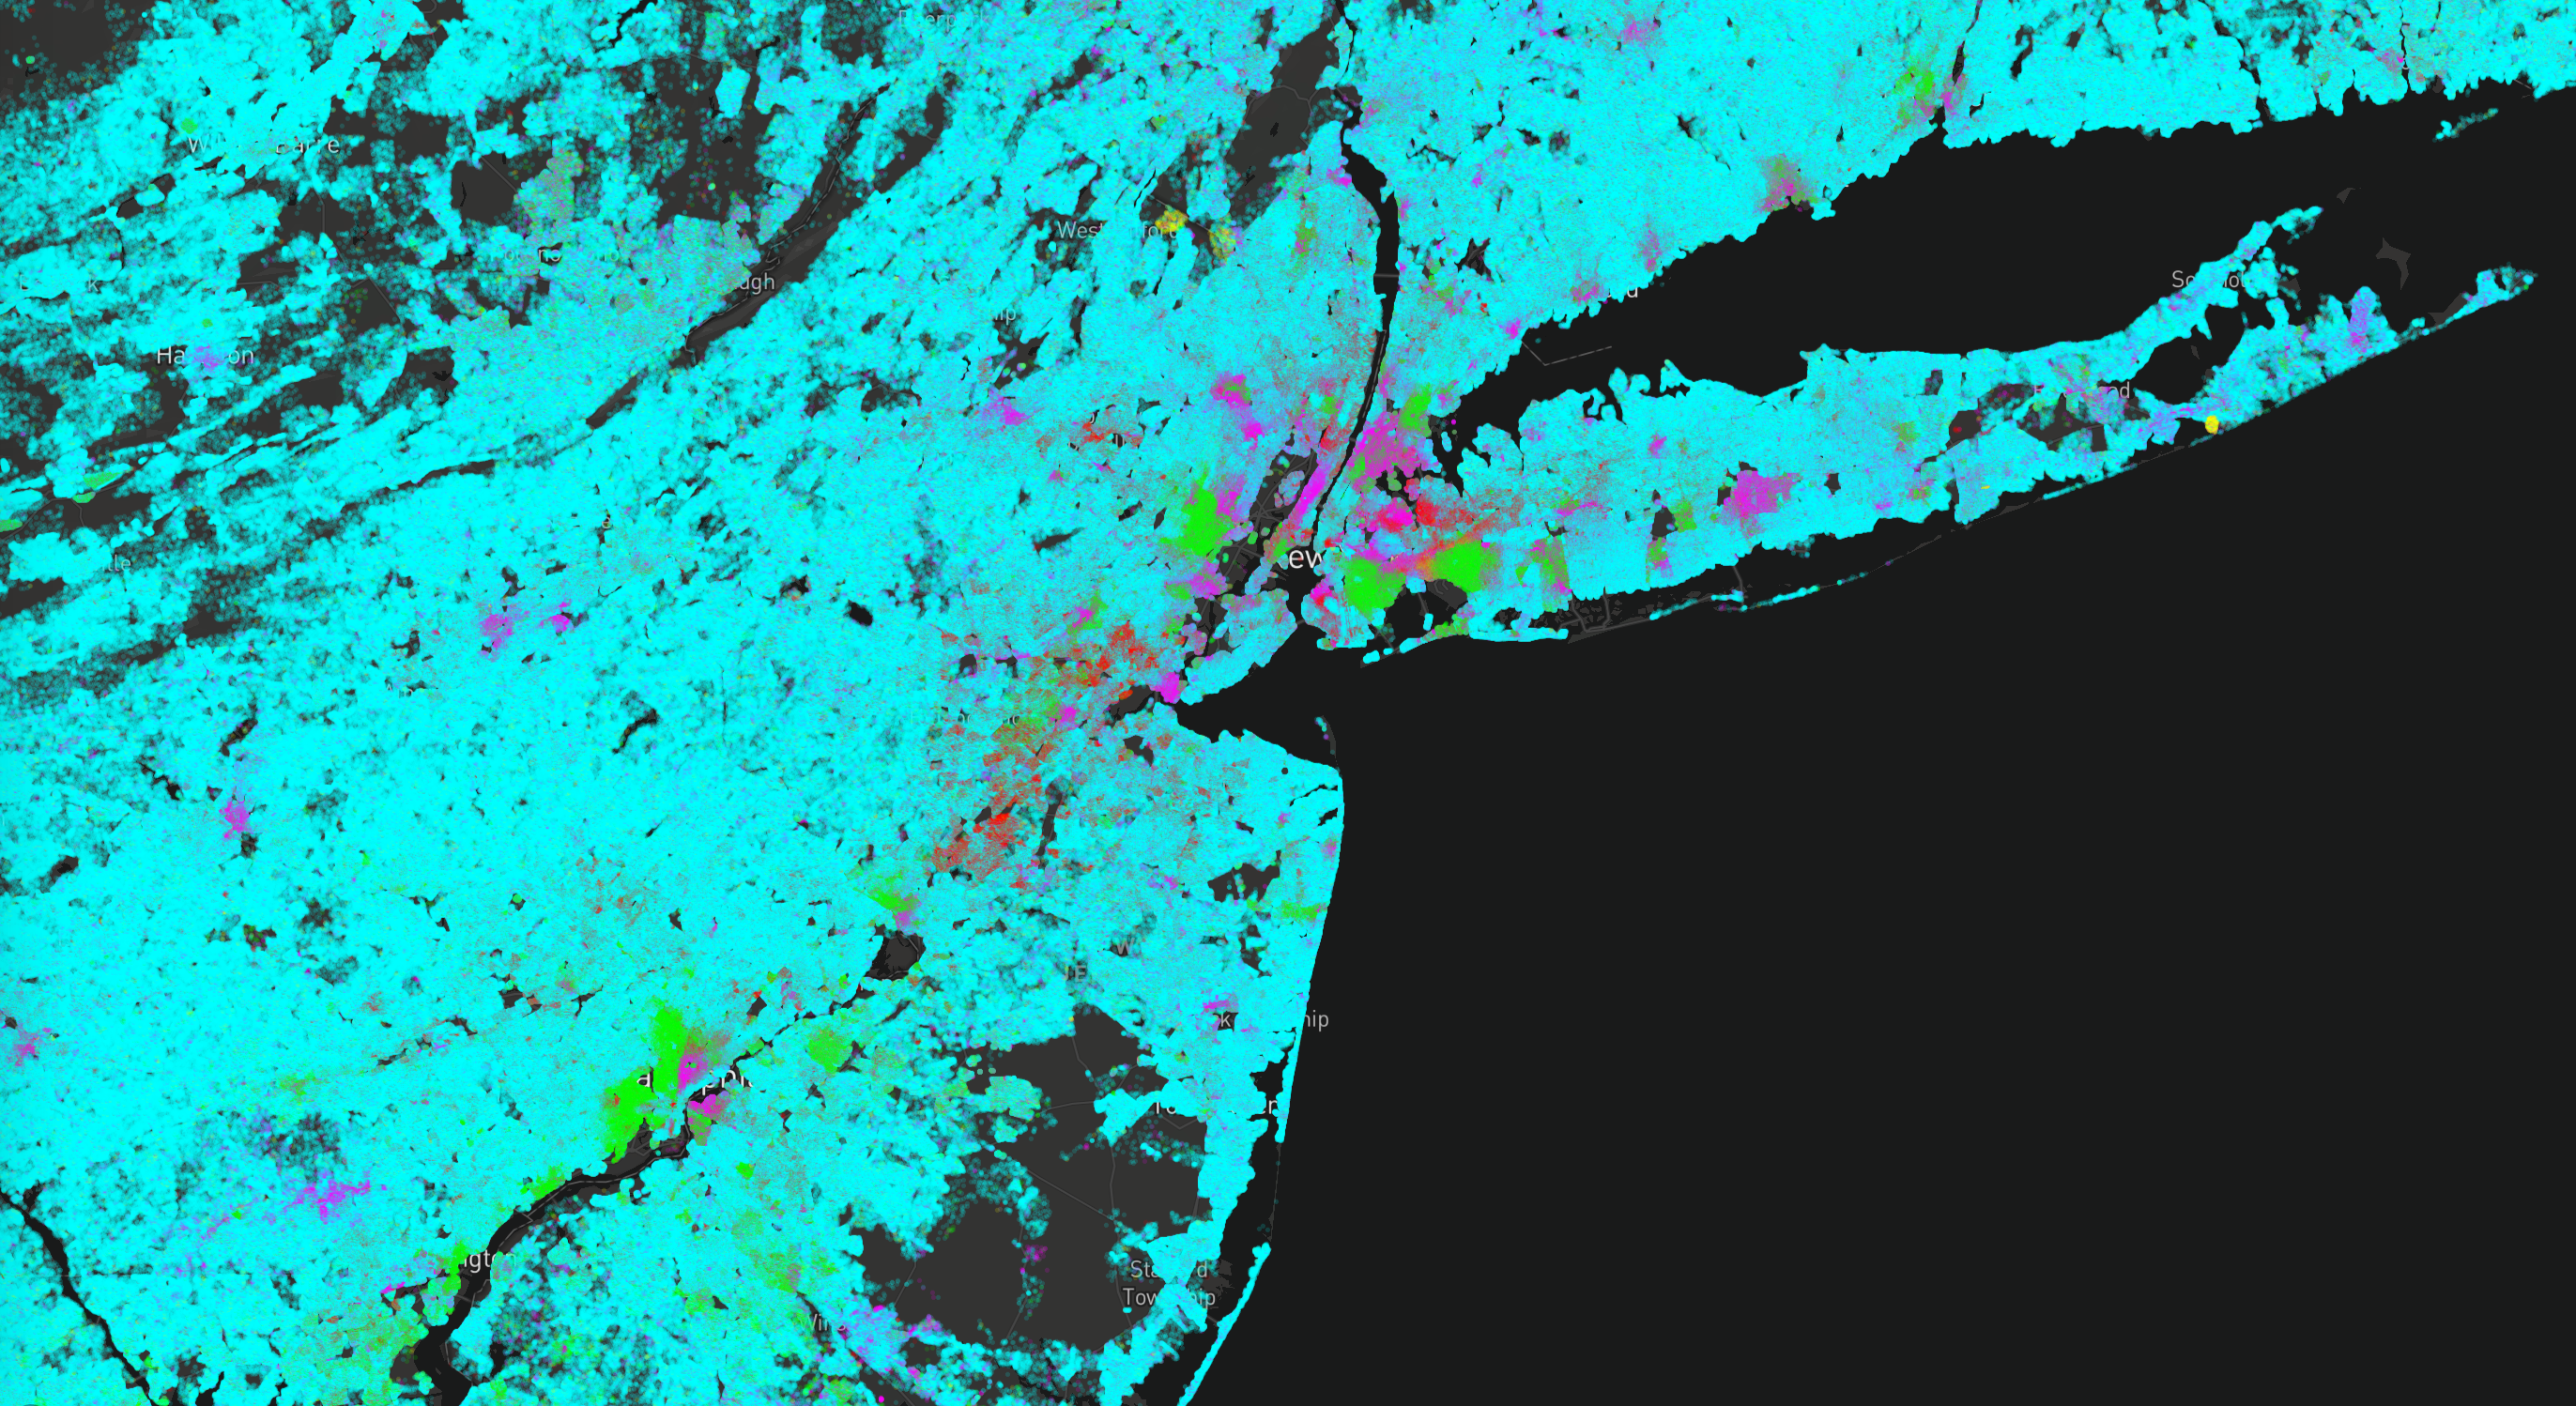
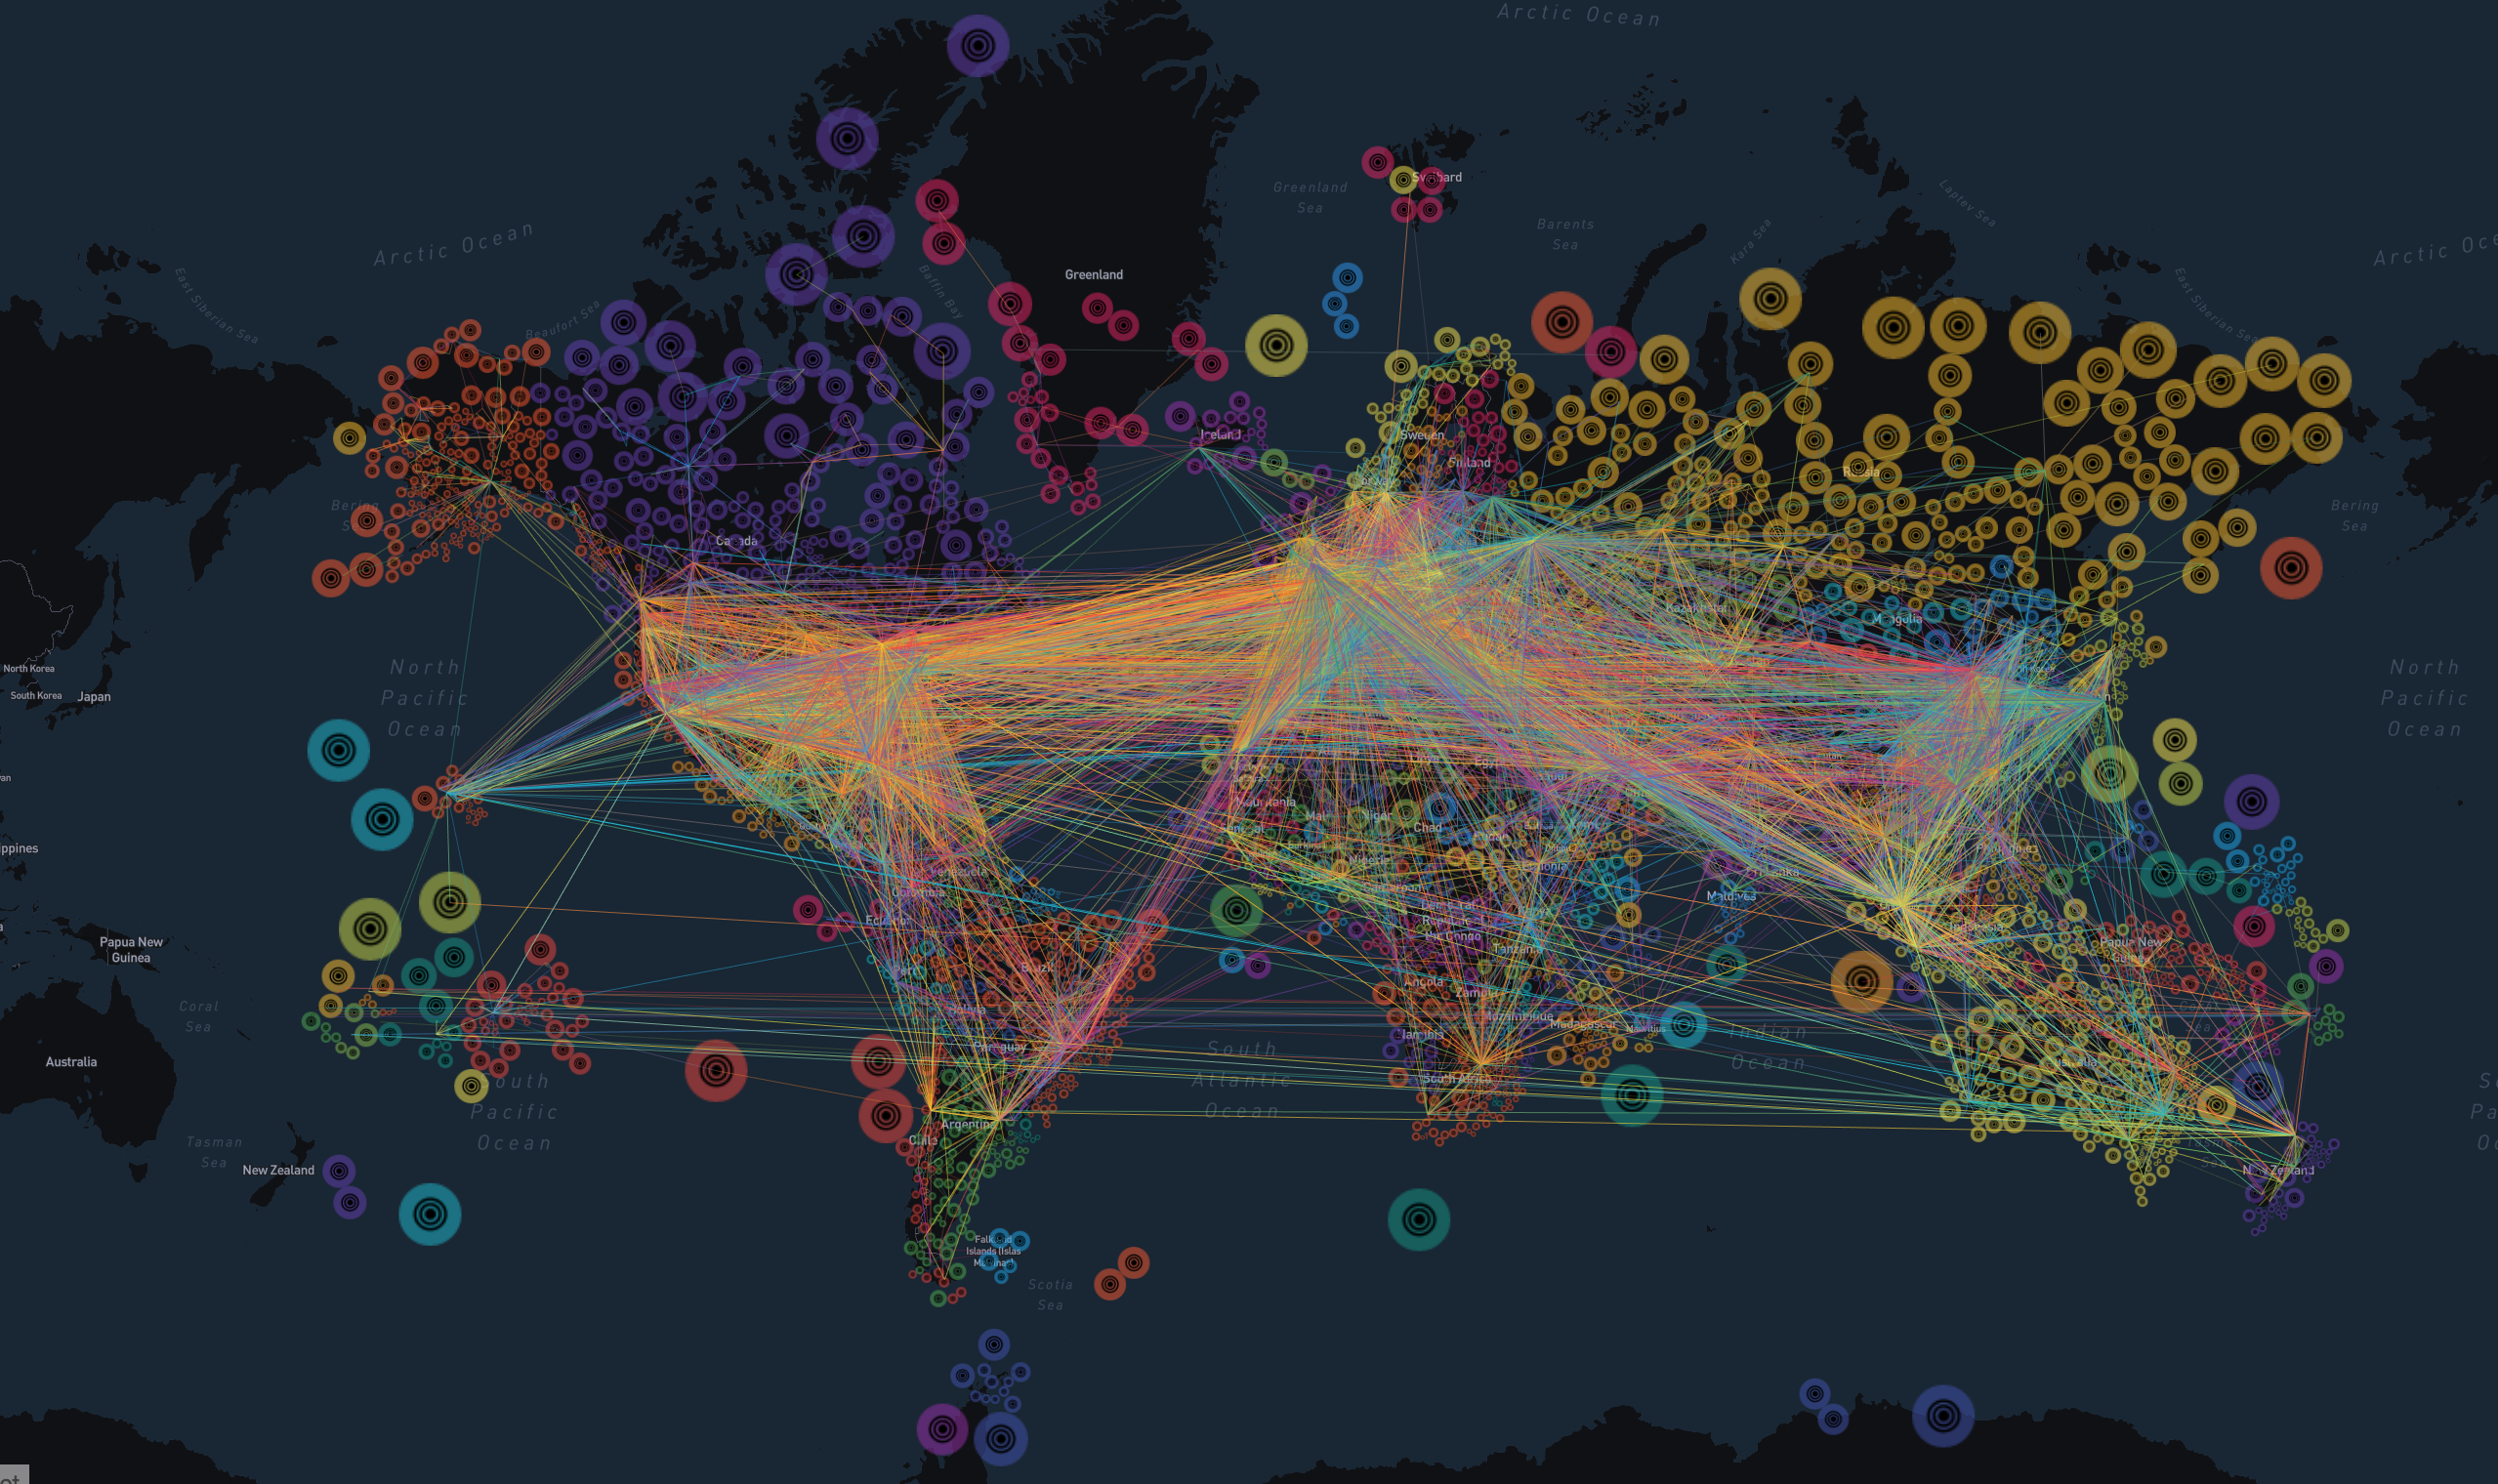
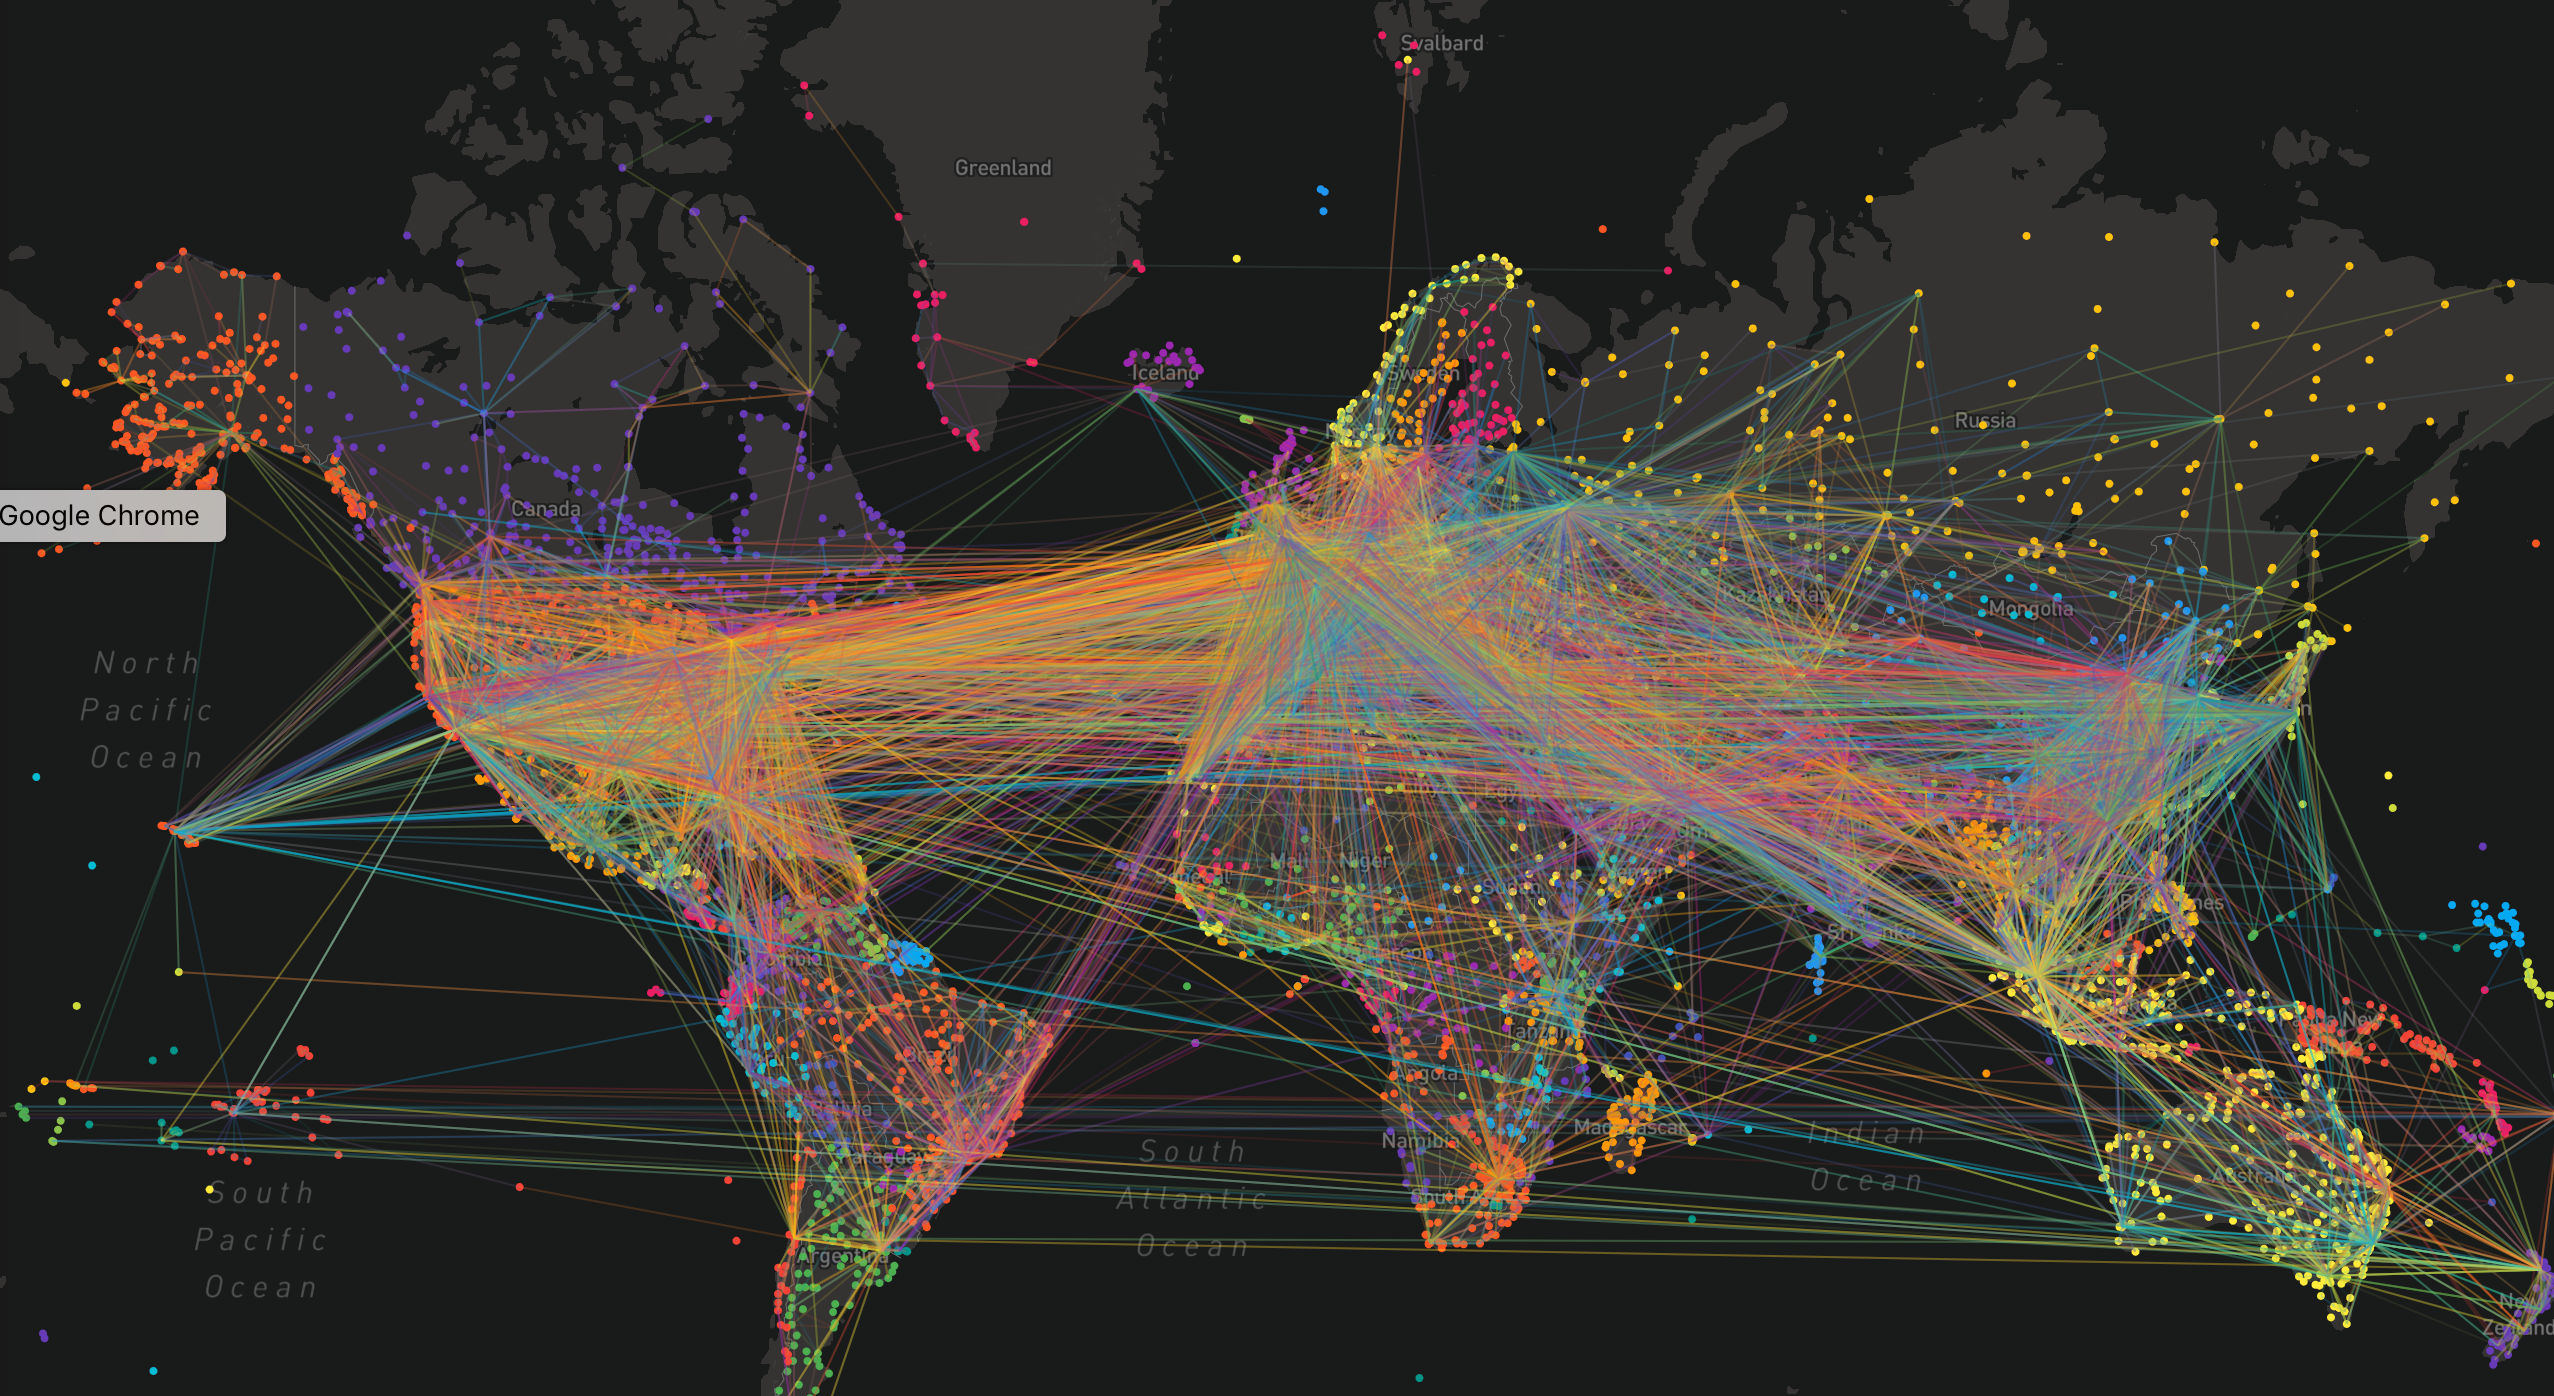
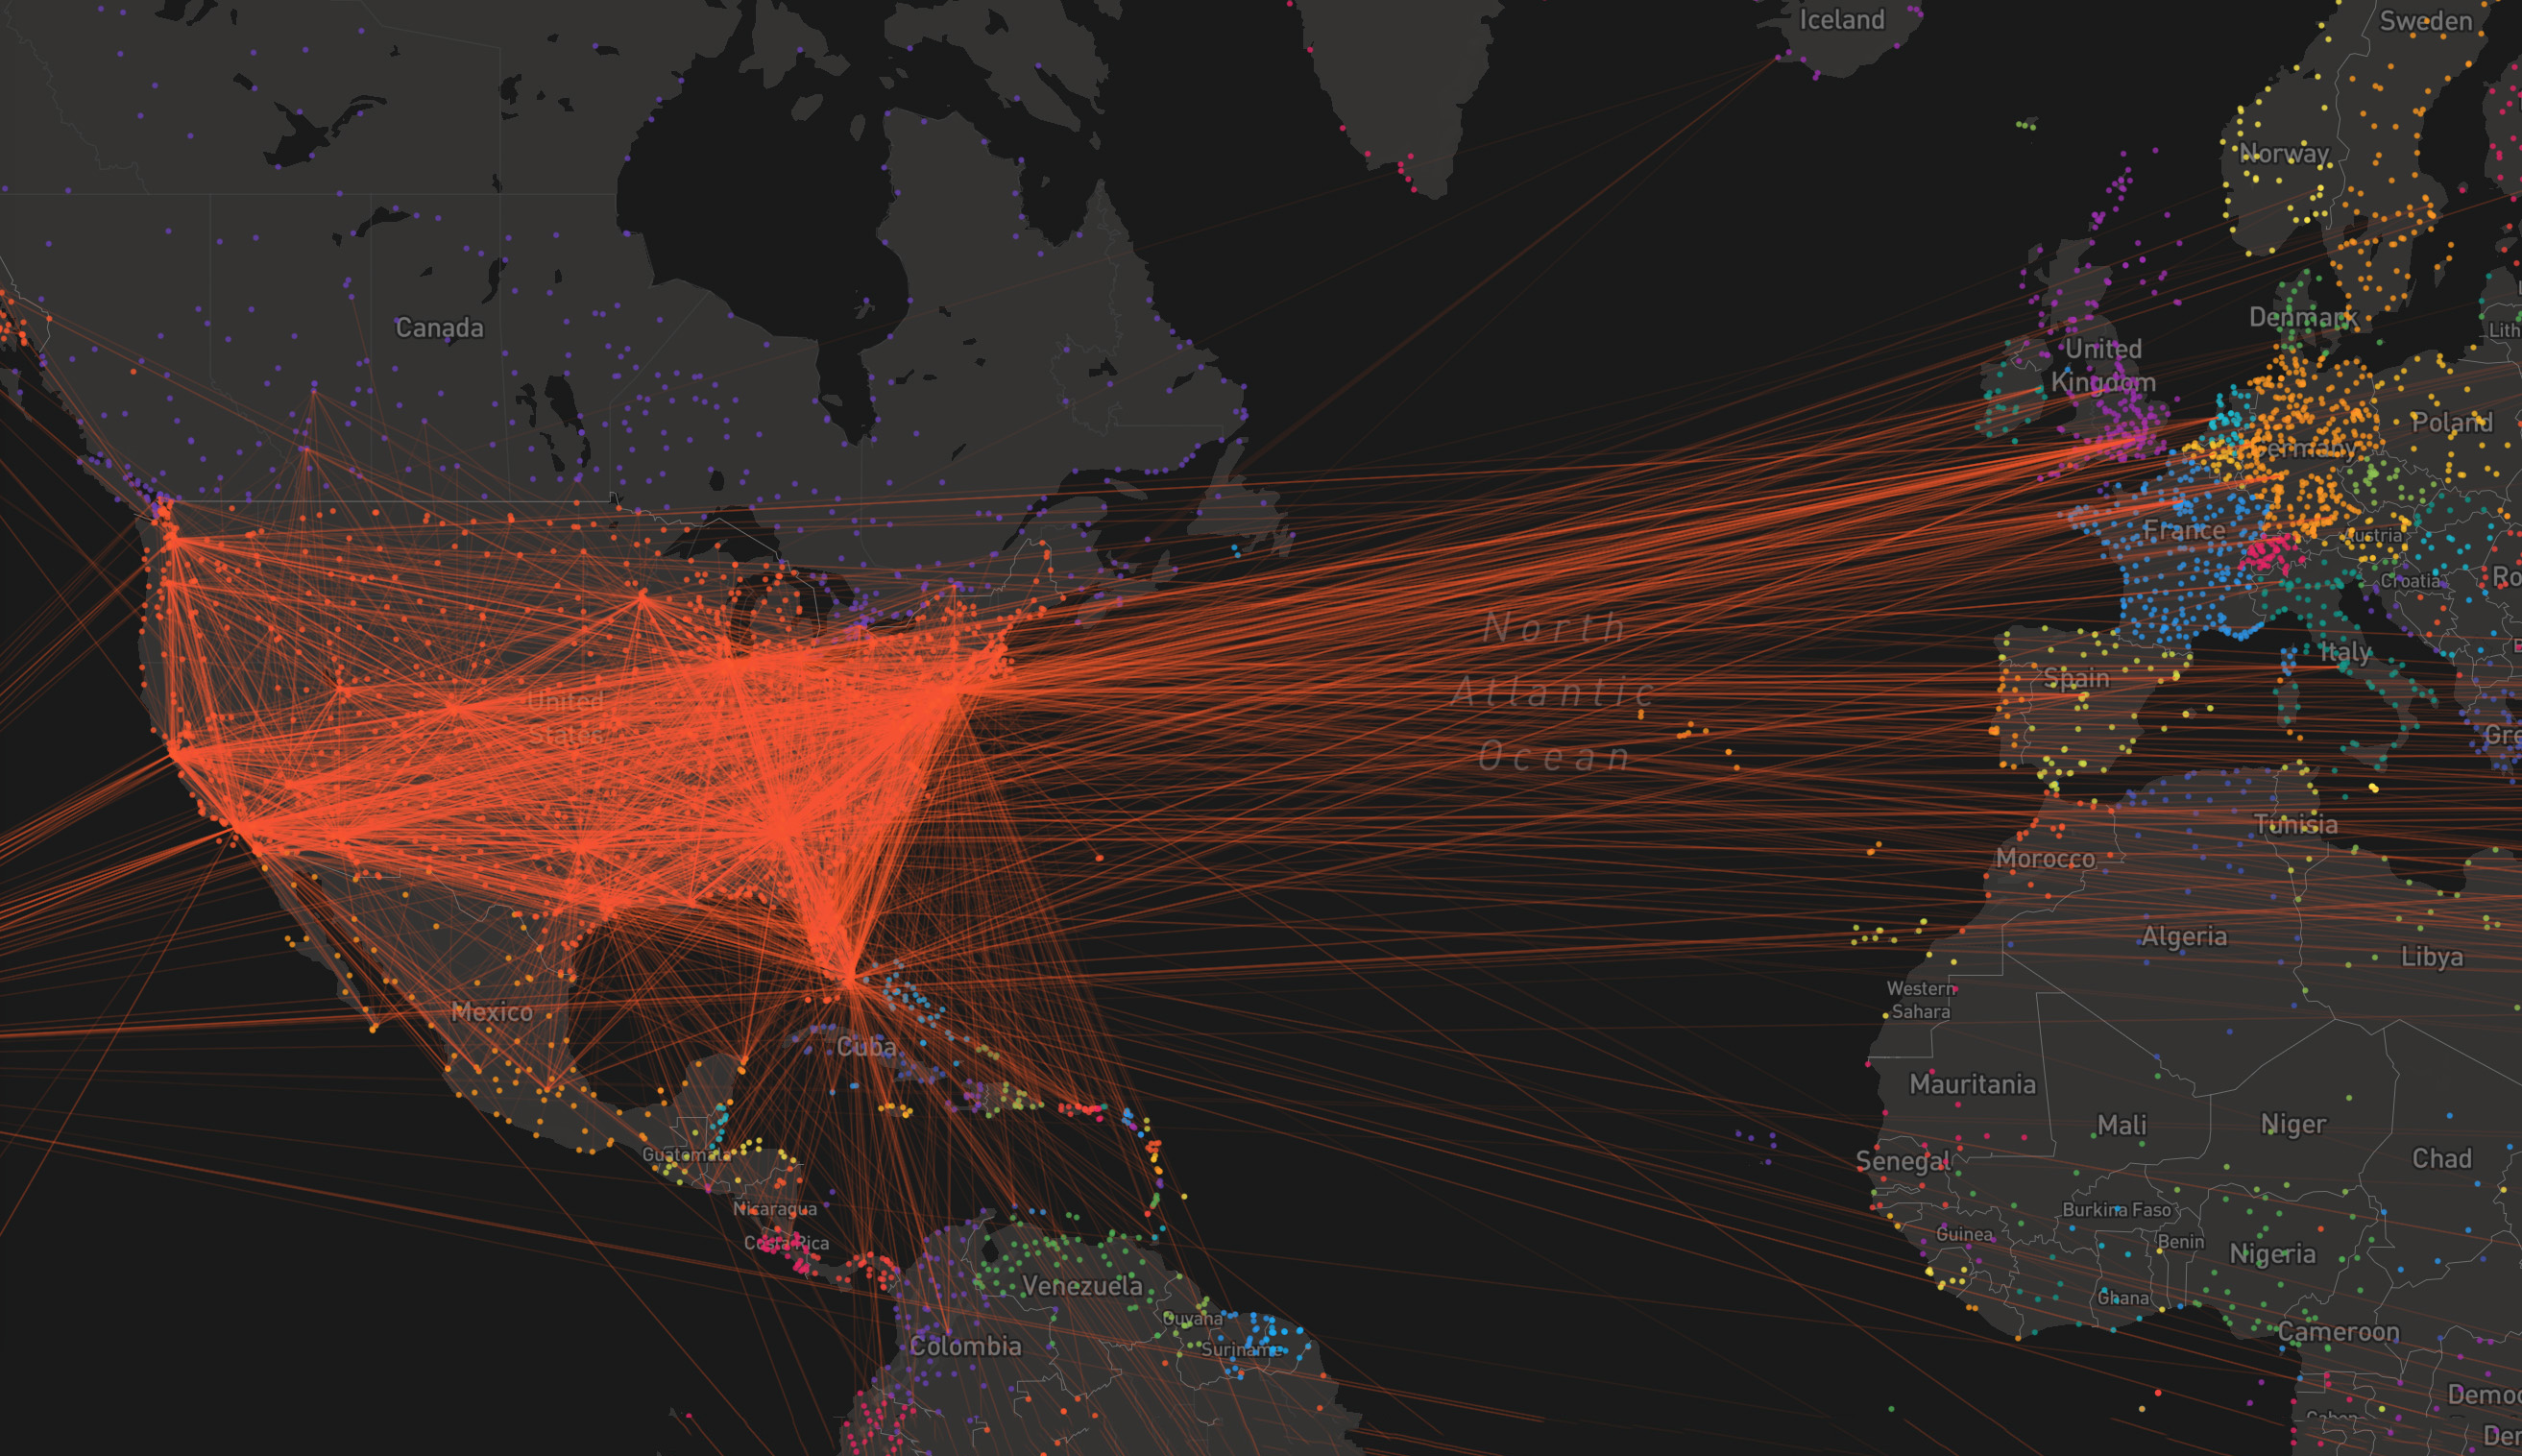
Faithfully distribution of 3 billion points on an interactive map. Achieved with data shader and d3

NYPD Motor Vehicle Collisions

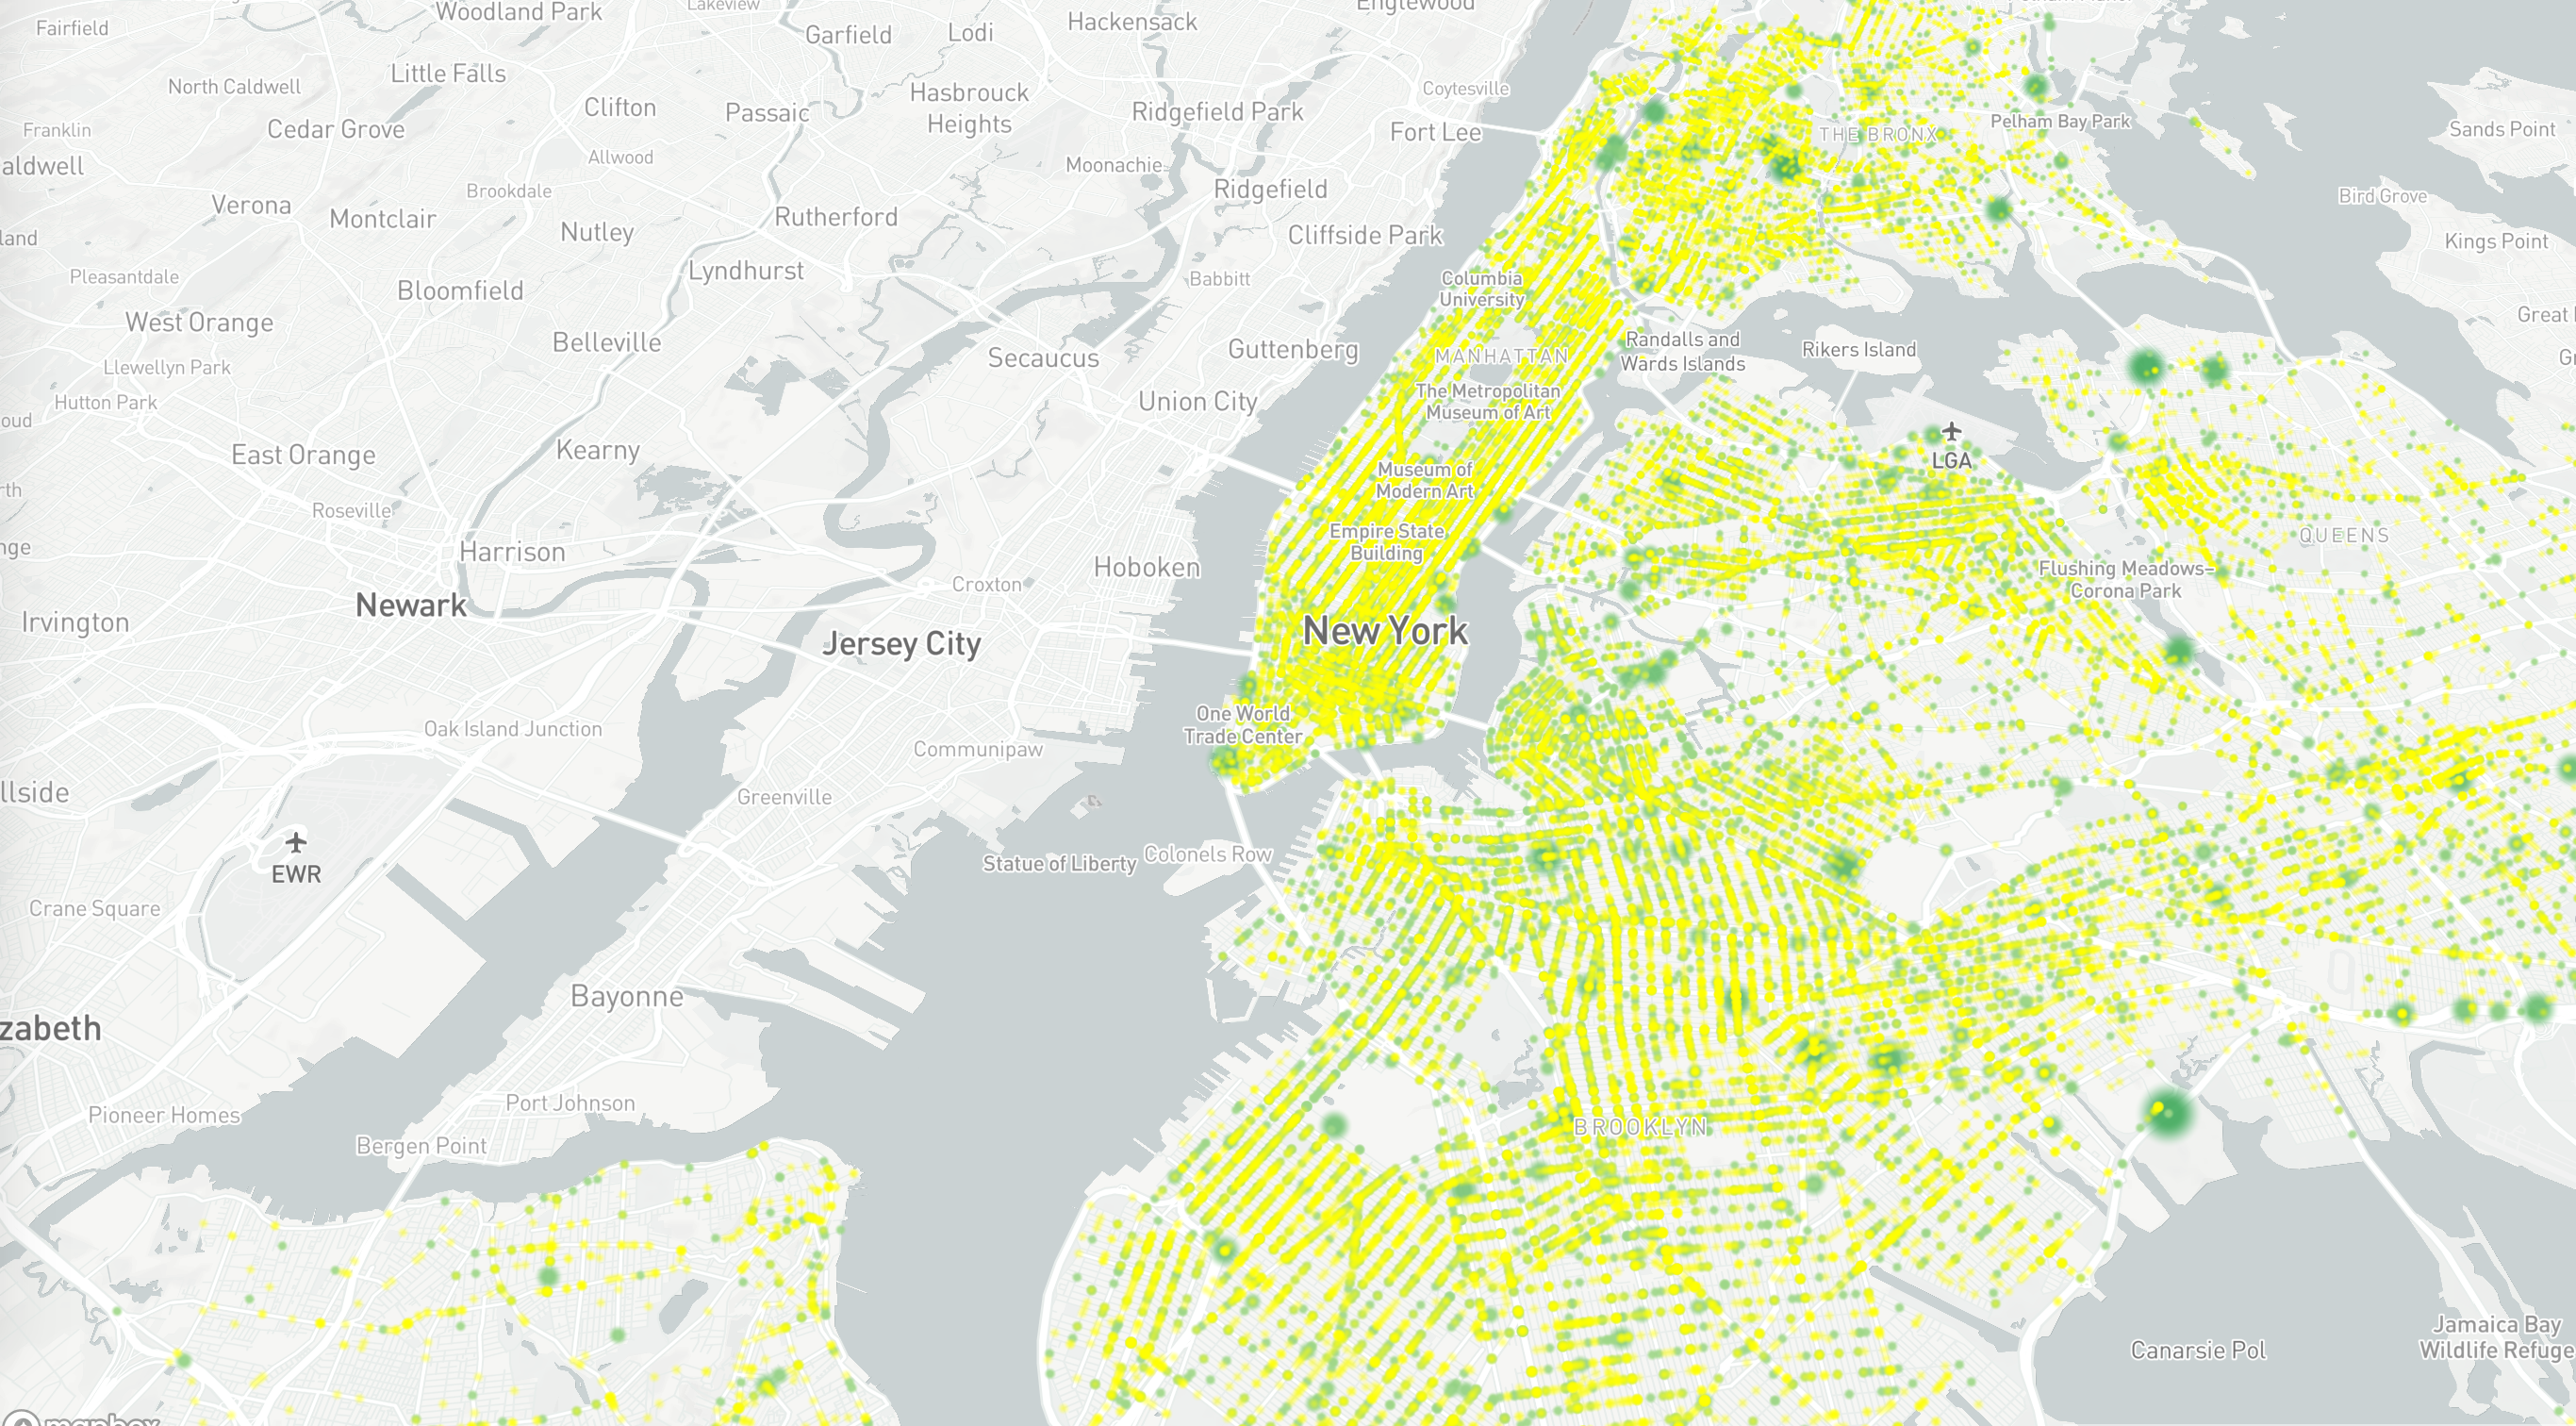
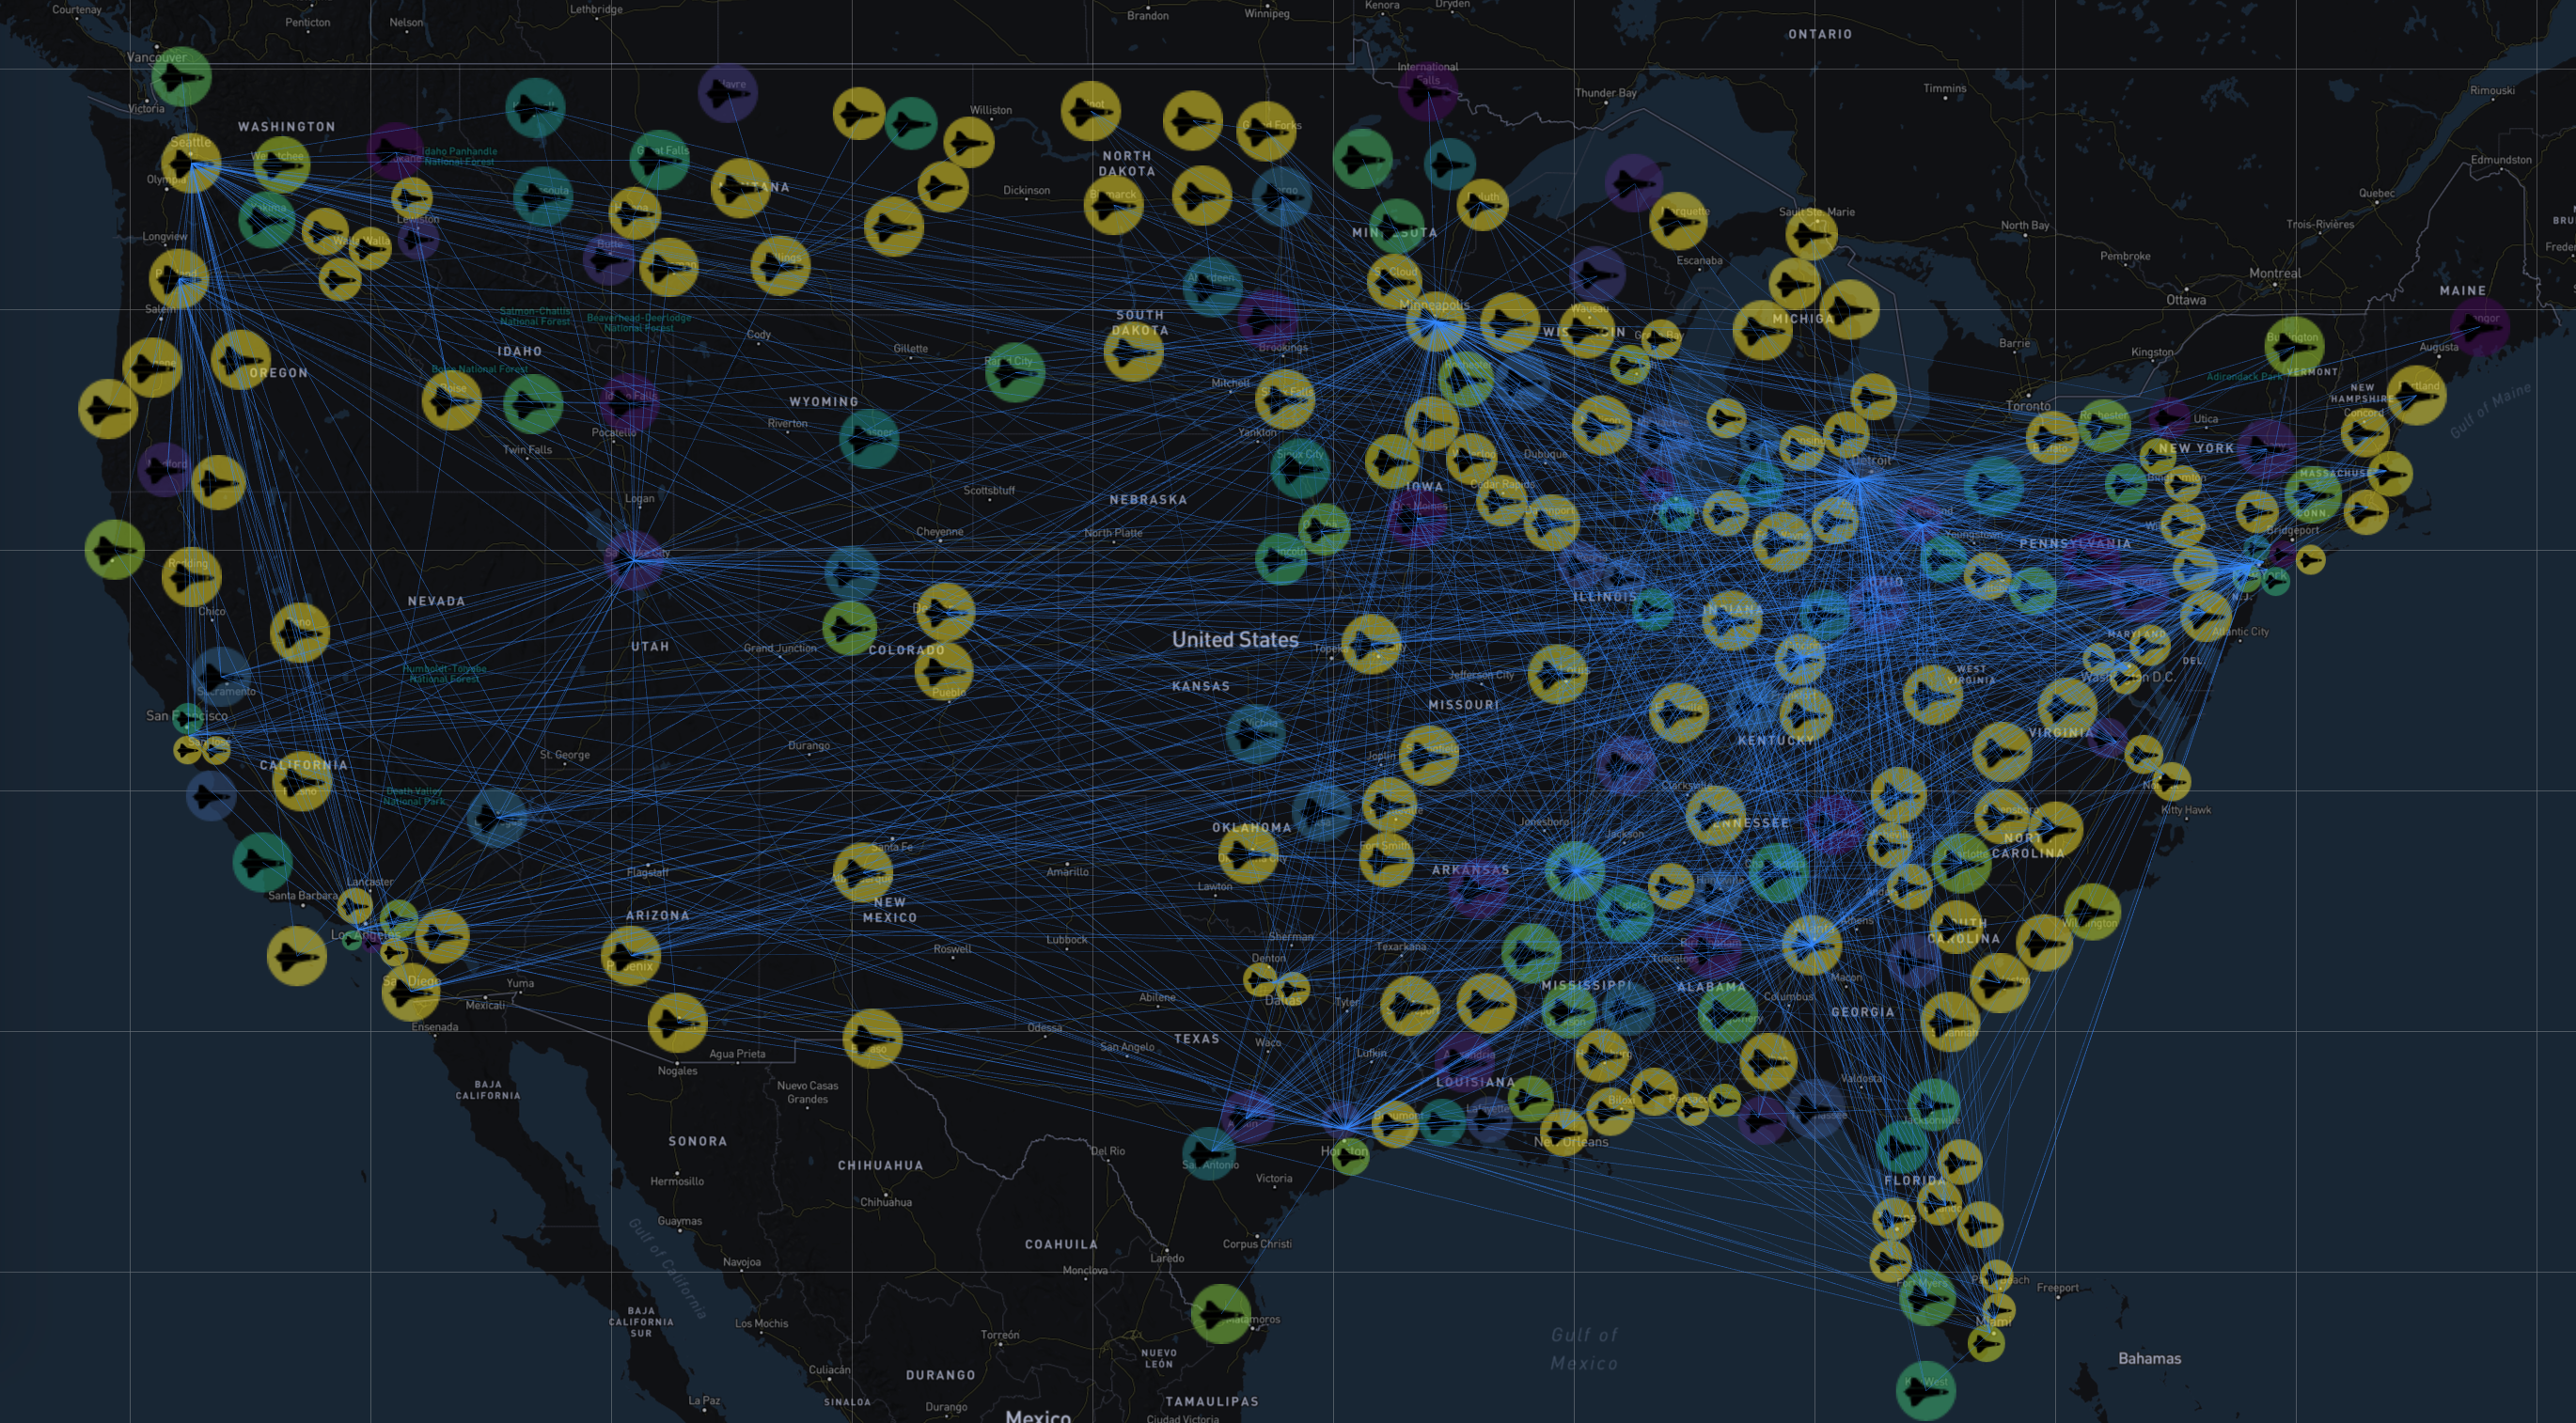
NYPD Motor Vehicle Collisions. Purely done with MapboxGL's data driven styling.

World Flights 8107 nodes, 65563 edges

World Flight GL

Routes colors stands for departure countries. Technology: D3, PIXI and mapbox.js.

World Flight Canvas

Achieved by overlaying canvas on mapbox.js. No icons (no conflict resolve) are used.

World Flight MapboxGL

Rendered purely with MapboxGL's data driven styling. You may choose a departure country to filter routes

U.S. Airlines

US Airline WebGL

Routes colors stands for departure countries. Technology: D3, PIXI and mapbox.js.

US Airline Canvas

Achieved by overlaying canvas on mapbox.js. No icons (no conflict resolve) are used.

US Airline SVG

Rendered purely with MapboxGL's data driven styling.